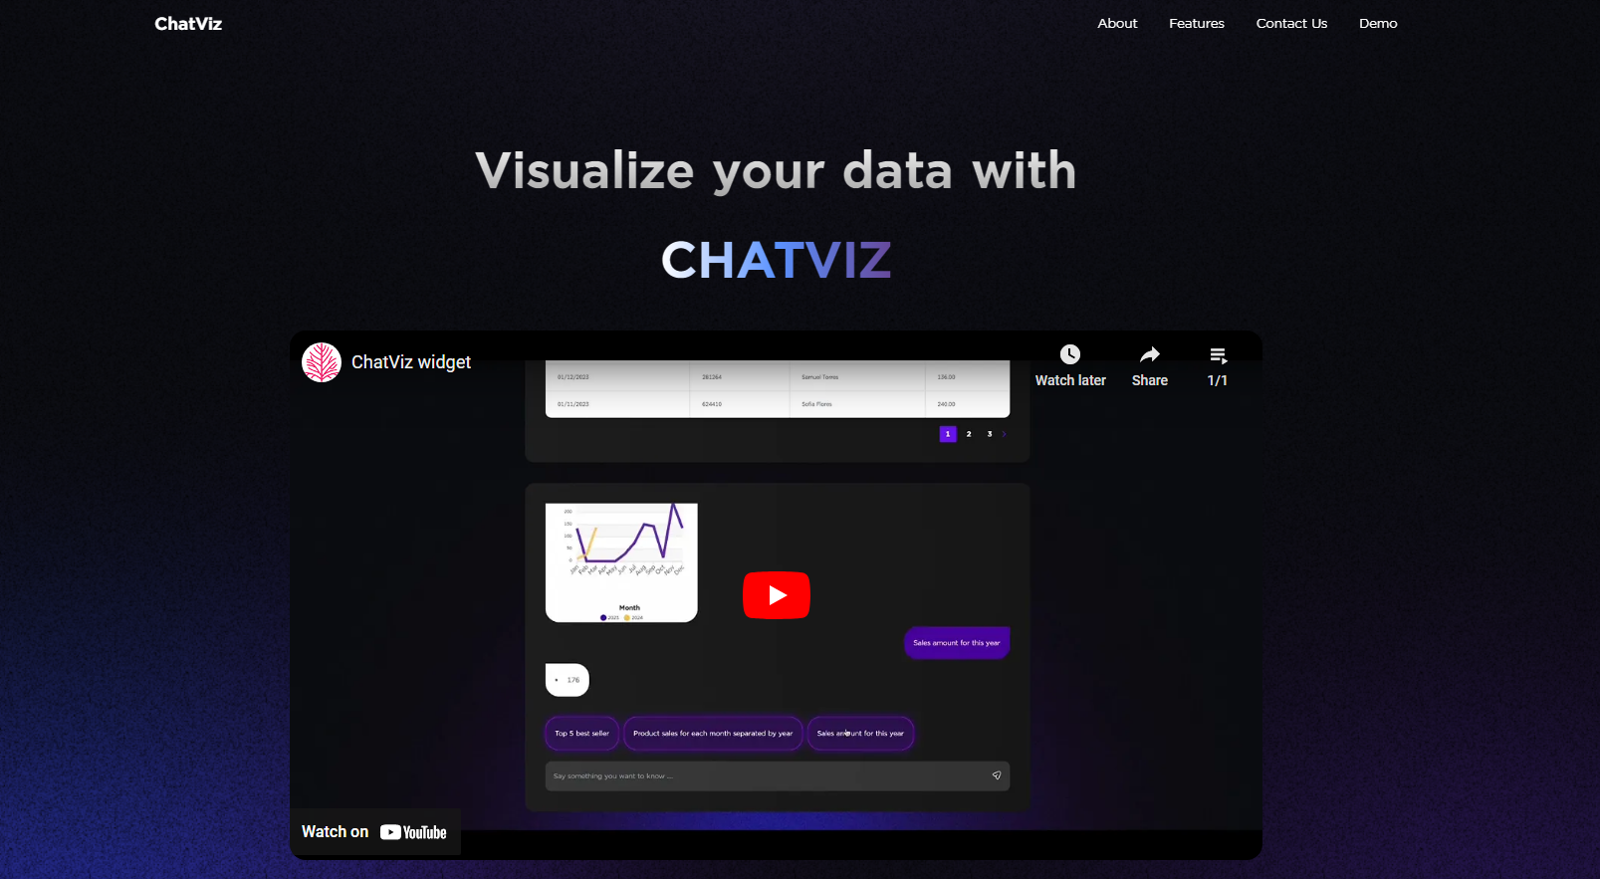
What is ChatViz?
ChatViz is a data visualization tool that leverages ChatGPT. It features an SQL translator and an automated chart generator for simplifying interactions with SQL databases and for assisting in choosing ideal data representation formats.
How does ChatViz improve data visualization?
ChatViz improves data visualization by implementing an SQL translator that rapidly generates SQL queries from user input, thus easing SQL database interactions. It also has an automated chart generator to guide users in selecting the most suitable chart for their dataset.
What is the SQL translator feature in ChatViz?
The SQL translator feature in ChatViz is a functionality that takes user input commands and instantly creates corresponding SQL queries, reducing the necessity for profound SQL knowledge and streamlining the interaction between the user and their SQL database.
What functions does the automated chart generator in ChatViz provide?
The automated chart generator in ChatViz provides chart recommendations optimal for a specific dataset provided by the user. It simplifies the process of selecting the best data representation format by automatically suggesting fitting charts.
How can I configure my SQL schema to ChatViz?
To configure your SQL schema to ChatViz, you need to input your SQL schema details into the ChatViz platform. Unfortunately, the exact method or steps for the configuration are not explicit on their website.
What information does the ChatViz webhook communicate?
The ChatViz webhook communicates the output data from your SQL schema after it has been configured to ChatViz. This data is then visualized by ChatViz.
How does ChatViz reduce development time?
ChatViz reduces development time by automating the processes of SQL query generation and chart selection. Through its SQL translator and automated chart generator, it hastens data interpretation and representation, cutting down the time needed for these tasks.
How does ChatViz assist with overcoming dashboard complexity?
ChatViz helps overcome dashboard complexity by providing an effective and simpler way of visualizing data. Using an automated chart generator, it aids users in choosing the most appropriate chart representation for their dataset, simplifying the often complex process of selecting suitable visualization formats in dashboards.
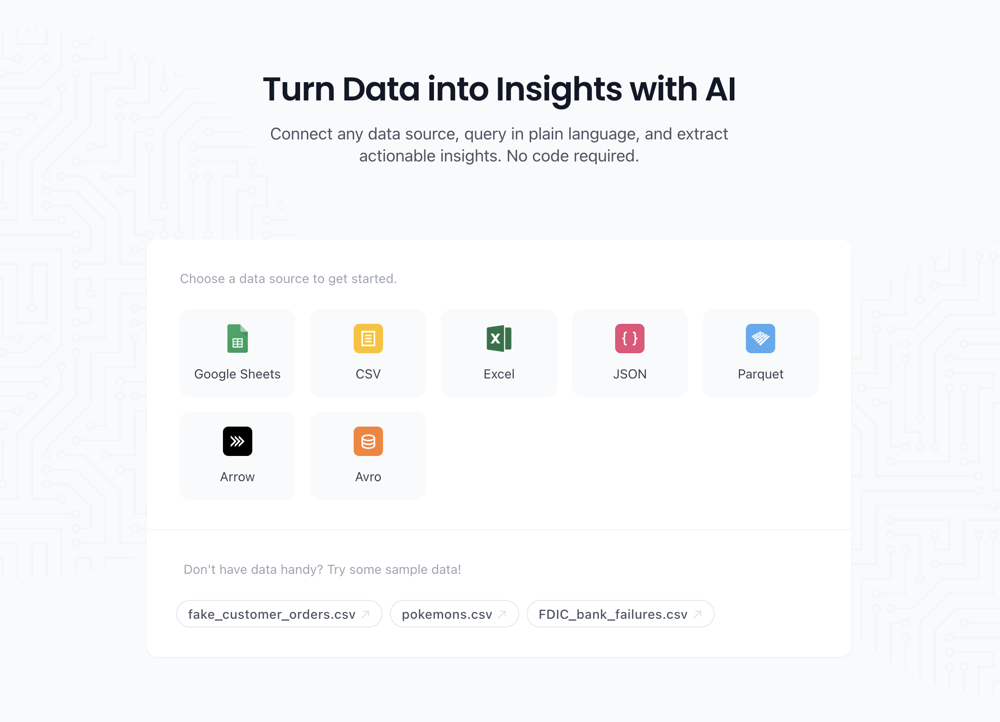
What is the process to start using the ChatViz tool?
To start using ChatViz tool, first, you need to configure your SQL schema to ChatViz. Secondly, set up a webhook that will connect with our ChatViz tool. Finally, ChatViz will interpret and visually represent the output data from the established webhook.
What type of input commands can the SQL translator in ChatViz handle?
The SQL translator in ChatViz can handle user input commands. The precise nature or complexity of these commands isn't stated on their website.
How does the ChatViz widget work?
The ChatViz widget is a configurable tool that visualizes the output data from your webhook after you have configured your SQL schema to ChatViz and established the webhook connection.
Are there any requirements for the dataset when using the automated chart generator in ChatViz?
The specific requirements for the dataset when using the automated chart generator in ChatViz are not stated on their website.
Is there a demo available for the ChatViz tool?
Yes, a demo is available for the ChatViz tool according to the information on their website.
What improvements can I expect in user experience using ChatViz?
Using ChatViz, users can expect improvements in their data visualization experience such as streamlined interaction with SQL databases, quick SQL queries from user commands, automated chart suggestions for datasets, and an overall enhanced data representation process.
Can the SQL translator in ChatViz handle complex queries?
The capability of the SQL translator in ChatViz to handle complex queries isn't specified on their website.
How does ChatViz suggest the most suitable charts for my dataset?
ChatViz suggests the most suitable charts for your dataset through its automated chart generator. This feature considers the specifics of your input data to recommend the most fitting chart types for visualizing your data.
What's the benefit of using the ChatViz widget for data visualization?
The benefit of using the ChatViz widget for data visualization lies in the automation it brings to the process. It aids in reducing development time by assuming the task of SQL query generation and chart selection, thus simplifying data visualization tasks.
Which types of charts can ChatViz's automated chart generator suggest?
The specific types of charts the automated chart generator in ChatViz can suggest are not specified on their website.
How does ChatViz streamline the interaction with my SQL database?
ChatViz streamlines interaction with SQL databases through its SQL translator. It takes user inputs and instantly generates corresponding SQL queries, lowering the need for detailed SQL knowledge and simplifying the process of working with SQL databases.
How do I set up a webhook to communicate with ChatViz?
The exact method to set up a webhook to communicate with ChatViz isn't clearly enumerated on their website.
 15,191

 552
552 424
424 402153
 38
38 28
28 18
18 18
18 11
11 111
111 9
9 7
7 7
7 5
5 47
47 4184
4184 322
322 3
3 316
316 2100
2100 1
1 Technical expert on Data Visualization and database integration11
 115
115 19
19 17
17 Create 'Fool Around/Find Out' line charts for your plans.9
 100
100 11
11 97
97 Guides in choosing the right business data visualizations.
 13
13 10
10 105
105 Automatically tile all professionals and equipment.11